Beef, rib eye steak/roast, bone-in, lip-on, separable lean and fat, trimmed to 1/8" fat, all grades, raw vs. Steak — In-Depth Nutrition Comparison
Compare
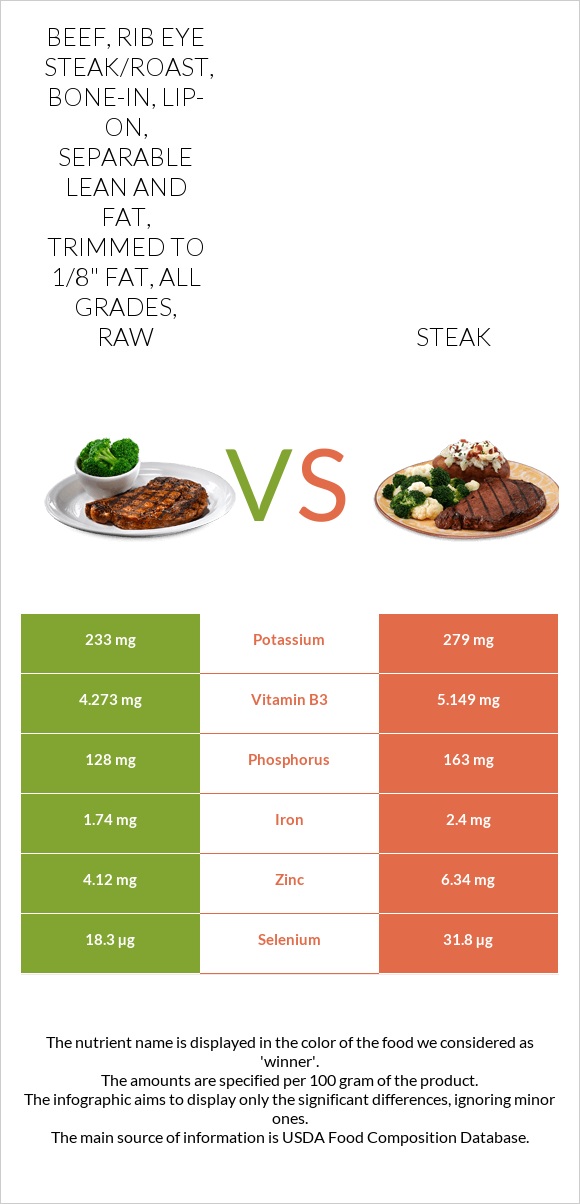
How are beef, rib eye steak/roast, bone-in, lip-on, separable lean and fat, trimmed to 1/8" fat, all grades, raw and steak different?
- Steak has more selenium, zinc, vitamin B12, iron, vitamin B6, and vitamin B3 than beef, rib eye steak/roast, bone-in, lip-on, separable lean, and fat, trimmed to 1/8" fat, all grades, raw.
- Daily need coverage for selenium for steak is 25% higher.
Beef, rib eye steak/roast, bone-in, lip-on, separable lean, and fat, trimmed to 1/8" fat, all grades, raw and Beef, rib eye steak, boneless, lip off, separable lean, and fat, trimmed to 0" fat, all grades, cooked, grilled are the varieties used in this article.
Infographic
Infographic link
Mineral Comparison
Mineral comparison score is based on the number of minerals by which one or the other food is richer. The "coverage" charts below show how much of the daily needs can be covered by 300 grams of the food.
| Contains more ManganeseManganese | +∞% |
| Contains more MagnesiumMagnesium | +27.8% |
| Contains more CalciumCalcium | +20% |
| Contains more PotassiumPotassium | +19.7% |
| Contains more IronIron | +37.9% |
| Contains more CopperCopper | +32.8% |
| Contains more ZincZinc | +53.9% |
| Contains more PhosphorusPhosphorus | +27.3% |
| Contains more SeleniumSelenium | +73.8% |
Vitamin Comparison
Vitamin comparison score is based on the number of vitamins by which one or the other food is richer. The "coverage" charts below show how much of the daily needs can be covered by 300 grams of the food.
| Contains more Vitamin EVitamin E | +∞% |
| Contains more Vitamin DVitamin D | +100% |
| Contains more Vitamin B1Vitamin B1 | +13.5% |
| Contains more Vitamin B5Vitamin B5 | +∞% |
| Contains more Vitamin AVitamin A | +40% |
| Contains more Vitamin B2Vitamin B2 | +27.5% |
| Contains more Vitamin B3Vitamin B3 | +20.5% |
| Contains more Vitamin B6Vitamin B6 | +21.1% |
| Contains more Vitamin B12Vitamin B12 | +26.4% |
| Contains more FolateFolate | +100% |
All nutrients comparison - raw data values
| Nutrient |  |
 |
DV% diff. |
| Selenium | 18.3µg | 31.8µg | 25% |
| Zinc | 4.12mg | 6.34mg | 20% |
| Vitamin B12 | 1.74µg | 2.2µg | 19% |
| Protein | 18.13g | 24.85g | 13% |
| Vitamin B5 | 0.481mg | 10% | |
| Iron | 1.74mg | 2.4mg | 8% |
| Choline | 43.1mg | 8% | |
| Vitamin B6 | 0.413mg | 0.5mg | 7% |
| Phosphorus | 128mg | 163mg | 5% |
| Vitamin B2 | 0.236mg | 0.301mg | 5% |
| Vitamin B3 | 4.273mg | 5.149mg | 5% |
| Cholesterol | 69mg | 78mg | 3% |
| Manganese | 0.064mg | 3% | |
| Saturated fat | 9.097g | 8.443g | 3% |
| Fats | 20.31g | 19.02g | 2% |
| Copper | 0.064mg | 0.085mg | 2% |
| Calories | 255kcal | 271kcal | 1% |
| Magnesium | 18mg | 23mg | 1% |
| Potassium | 233mg | 279mg | 1% |
| Vitamin E | 0.15mg | 1% | |
| Vitamin D | 0.2µg | 0.1µg | 1% |
| Vitamin B1 | 0.084mg | 0.074mg | 1% |
| Folate | 3µg | 6µg | 1% |
| Monounsaturated fat | 9.717g | 9.171g | 1% |
| Vitamin D | 6 IU | 6 IU | 0% |
| Calcium | 10mg | 12mg | 0% |
| Sodium | 56mg | 58mg | 0% |
| Vitamin A | 5µg | 7µg | 0% |
| Vitamin K | 1.5µg | 1.6µg | 0% |
| Trans fat | 1.309g | N/A | |
| Polyunsaturated fat | 0.907g | 0.896g | 0% |
| Tryptophan | 0.203mg | 0.278mg | 0% |
| Threonine | 0.854mg | 1.171mg | 0% |
| Isoleucine | 0.844mg | 1.157mg | 0% |
| Leucine | 1.563mg | 2.142mg | 0% |
| Lysine | 1.736mg | 2.38mg | 0% |
| Methionine | 0.491mg | 0.672mg | 0% |
| Phenylalanine | 0.727mg | 0.997mg | 0% |
| Valine | 0.906mg | 1.242mg | 0% |
| Histidine | 0.679mg | 0.931mg | 0% |
| Omega-3 - EPA | 0g | 0.001g | N/A |
| Omega-3 - DHA | 0g | 0.001g | N/A |
| Omega-3 - ALA | 0.029g | N/A | |
| Omega-3 - DPA | 0.01g | 0.013g | N/A |
| Omega-6 - Dihomo-gamma-linoleic acid | 0.022g | N/A | |
| Omega-6 - Eicosadienoic acid | 0.004g | N/A | |
| Omega-6 - Linoleic acid | 0.612g | N/A |
Macronutrient Comparison
Macronutrient breakdown side-by-side comparison
Protein:
18.13 g
Fats:
20.31 g
Carbs:
0 g
Water:
60.8 g
Other:
0.76 g
Protein:
24.85 g
Fats:
19.02 g
Carbs:
0 g
Water:
55.59 g
Other:
0.54 g
| Contains more OtherOther | +40.7% |
| Contains more ProteinProtein | +37.1% |
~equal in
Fats
~19.02g
~equal in
Carbs
~0g
~equal in
Water
~55.59g
Fat Type Comparison
Fat type breakdown side-by-side comparison
Saturated fat:
Sat. Fat
9.097 g
Monounsaturated fat:
Mono. Fat
9.717 g
Polyunsaturated fat:
Poly. Fat
0.907 g
Saturated fat:
Sat. Fat
8.443 g
Monounsaturated fat:
Mono. Fat
9.171 g
Polyunsaturated fat:
Poly. Fat
0.896 g
~equal in
Saturated fat
~8.443g
~equal in
Monounsaturated fat
~9.171g
~equal in
Polyunsaturated fat
~0.896g